Quick start guide
Usage
Load data, and (if necessary) compute log dilutions:
import ititer as it
import pandas as pd

df = pd.read_csv("path/to/data.csv")

df["Log Dilution"] = it.titer_to_index(df["Dilution"], start=40, fold=4)

df.head().round(2)
Sample |
OD |
Dilution |
Log Dilution |
|---|---|---|---|
21-P0004-v001sr01 |
1.371 |
40 |
0.0 |
21-P0004-v001sr01 |
0.981 |
160 |
1.0 |
21-P0004-v001sr01 |
0.535 |
640 |
2.0 |
21-P0004-v001sr01 |
0.182 |
2560 |
3.0 |
21-P0004-v001sr01 |
0.064 |
10240 |
4.0 |
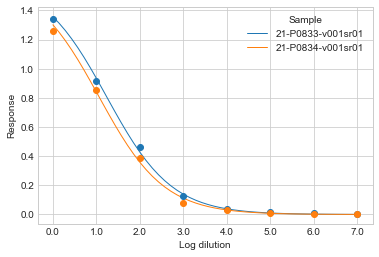
Fit and visualize sigmoid curves:
sigmoid = it.Sigmoid().fit(
    response="OD",
    sample_labels="Sample",
    log_dilution="Log Dilution",
)

sigmoid.plot_samples(["21-P0833-v001sr01", "21-P0834-v001sr01"])
Export inflection (or endpoint) titers and their highest density intervals:
df_inflections = sigmoid.inflections(hdi_prob=0.95)

df_inflection_titers = it.index_to_titer(df_inflections, start=40, fold=4)

df_inflection_titers.head().round(2)
sample |
mean |
median |
hdi low |
hdi high |
|---|---|---|---|---|
21-P0425-v001sr01 |
141.43 |
141.58 |
117.89 |
169.98 |
21-P0917-v001sr01 |
501.36 |
501.69 |
422.53 |
601.65 |
21-P0796-v001sr01 |
1294.1 |
1294.03 |
1102.35 |
1544.14 |
21-P0680-v001sr01 |
676.47 |
676.82 |
563.92 |
807.78 |
21-P0800-v001sr01 |
19699.43 |
19744.58 |
16530.67 |
23644.44 |